Overview:
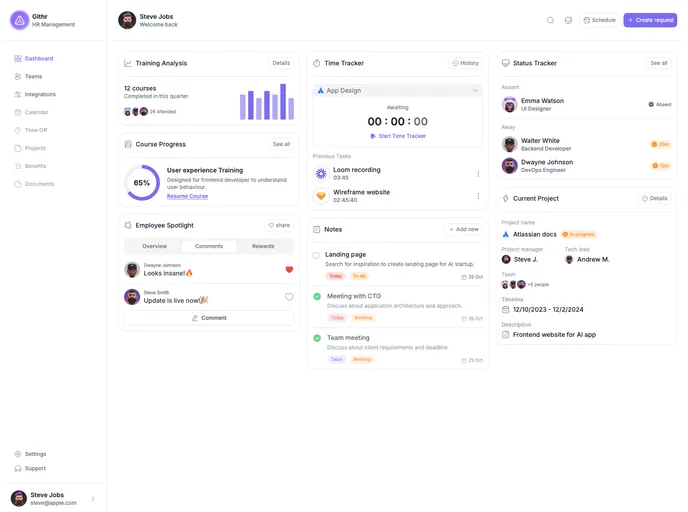
The Githr Dashboard is a user interface designed to provide a visual representation of various data and statistics related to a user’s GitHub account. It allows users to easily track and monitor their GitHub activity, including repositories, pull requests, issues, and more.
Features:
- Real-time updates: The dashboard provides real-time updates on the user’s GitHub data, ensuring that the displayed information is always up to date.
- Customizable widgets: Users can customize the layout of the dashboard by adding, removing, and rearranging widgets to suit their preferences and needs.
- Data visualization: The dashboard utilizes various charts and graphs to visually represent the user’s GitHub data, making it easy to interpret and analyze.
- Filtering and sorting: Users can filter and sort their GitHub data based on different criteria, such as repository name, activity type, and date range.
Installation:
To install the Githr Dashboard, follow these steps:
- Clone or download the repository from the provided link.
- Open the terminal and navigate to the downloaded directory.
- Install the required dependencies by running the following command:
npm install
- Once the dependencies are installed, start the local development server with the following command:
npm start
- Open the browser and go to
http://localhost:3000to access the dashboard.
Summary:
The Githr Dashboard is a powerful tool for GitHub users to track and analyze their activity on the platform. With its real-time updates, customizable widgets, and data visualization capabilities, it provides a user-friendly and efficient way to monitor GitHub data. The ease of installation and use make it a valuable tool for developers and teams looking to manage their GitHub repositories effectively.